cDSP Spectrogram
The spectrogram shows the signal frequency spectrum history.
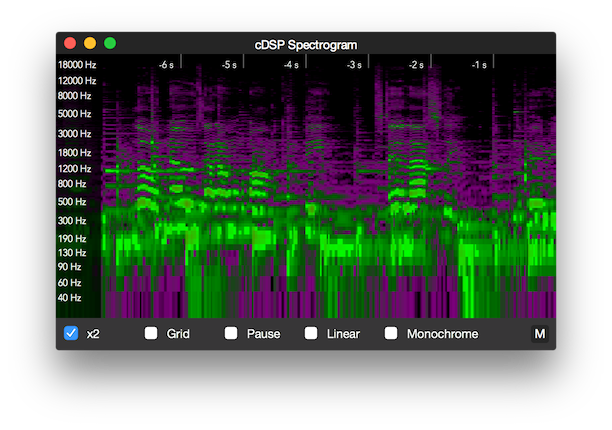
Parameters
x2
Switches between a time window of 8 and 16 seconds.
Grid
Show or hide the graph grid.
Linear
Switches between a linear or logarithmic frequency display.
Monochrome
Switches between a monochromatic or polychromatic display.
Pause
Freezes the graph in place.
Copyright © 2011 - 2026 LoudLAB. All rights reserved.
|
Products |
Downloads |
Support |
Follow Us |
Copyright © 2026 LoudLAB. All rights reserved. Terms & Conditions | Privacy Policy